COVID 19 Waste Generation Report
May 12, 2020
Paul van der Werf, Rob Cook & Peter Hargreave
Background
Work continues on developing a better understanding on possible impacts as a result of COVID-19 of residential and industrial, commercial and institutional (ICI) waste generation and management. To date there are thirteen Ontario municipalities and nine municipalities in Alberta, British Columbia, the Northwest Territories and Saskatchewan that are providing data. We also have a number of private sector waste companies, with operations across the country, providing data. As more data is captured it will allow us to develop a better understanding of trends across the country. To date, we have been able to summarize and analyze Ontario based data. In the next iteration of this report we will add our data analysis of Western Canada data.
It is important to understand that waste management flows are impacted by a number of factors from year to year (e.g., economic and population change, weather related events, changes to waste management programming, waste composition, etc.,). COVID-19 is not the only influence that might be influencing waste generation and flows. There is likely some impact in the residential numbers below as municipal governments often collect wastes from some small businesses on their residential routes.
Residential Waste Collection
Ontario
Compared to the same relevant week in 2019, the thirteen Ontario municipalities (with a population of approximately representing close to 8.5 million residents) surveyed to date are generally experiencing an increase in total residential waste generated with more pronounced increases in green bin and garbage (see Table 1).

Table 1 – Ontario Municipal Waste Flows (Weeks Starting 9 March 2020 to 27 April 2020)
Yard waste was excluded from the totals given many municipalities have suspended services and that yearly totals vary significantly based on weather conditions. With the exception of one municipality surveyed none of these programs allow leaf and yard materials in green bin collection.
Surveyed Ontario municipalities were further broken into three main groups – large urban / urban regional, and rural based on the Resource Productivity and Recovery Authority’s (RPRA) Datacall. Figure 1 provides a summary of average percentage changes per week changes as compared to the same weeks 2019 for large urban/urban regional municipalities. Initially there was considerable variability although this appears to have levelled off. The spike in green bin materials for the week of March 30, 2020 is related to the five municipalities that saw an increase of 15%+ compared to 2019. One of those municipalities accepts leaf and yard waste in their green bin.

Figure 1 – Ontario Large Urban / Urban Regional - Average 2020 vs 2019 % Change per Week
(Weeks Starting 9 March 2020 to 27 April 2020)
Figure 2 provides an overview of the differences in percentage change by waste stream for the eight large urban / urban regional municipalities. There is considerable variation between the municipalities. For some waste generation has remained relatively static, potentially the result of people migrating out of these communities given the closure of universities, colleges and certain businesses. For others there have been much greater waste generation rates (e.g., upwards of 15% increases in garbage and green bin materials).

Figure 2 – Average Percent Change 2020 vs 2019 by Ontario Large Urban / Urban Regional Municipality
(Weeks Starting 9 March 2020 to 27 April 2020)
To date, data has been received from four rural Ontario municipalities (See Figure 3). They are experiencing similar trends to the larger municipalities with overall increases in waste generation of almost 12% for garbage, but no real change in blue box materials. While waste generation increases, compared to 2019, were trending down it started to increase again at the end of April.
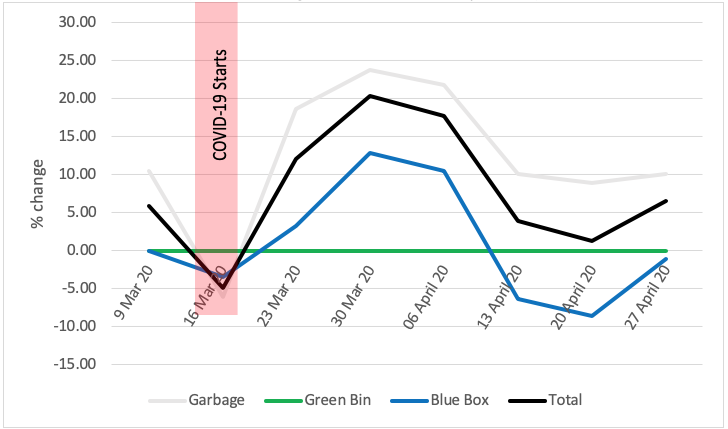
Figure 3 – Ontario Rural Municipalities - Average 2020 vs 2019 % Change per Week
(Weeks Starting 9 March 2020 to 27 April 2020)
Figure 4 provides an overview of the differences in percentage change by waste stream for the four rural municipalities illustrating the difference experiences.

Figure 4 – Average Percent Change 2020 vs 2019 by Ontario Rural Municipality
(Weeks Starting 9 March 2020 to 27 April 2020)
Western Canada and the Northwest Territories
While some data has been received from Western Canada, more data is necessary to gain a more complete picture of the current impact of COVID-19. To date the data received show reductions or a status quo in residential waste generation rates from 2019. Additional outreach will be undertaken to provide a more complete picture in the following weeks.
Industrial, Commercial & Institutional (ICI) Waste Collection
The majority of data collected to date on Industrial, Commercial & Institutional (ICI) waste collection is from Ontario but the small sample of data received from Western Canada does initially appear comparable. Generally, the waste flow data reflects economic activity variations and this is evident during the period. There is week over week variation, variability relative to specific sub-sectors, and potential tonnage burden shifts between the ICI and residential sectors. While ICI data is sparse to date, limited data submissions and anecdotal information indicate that ICI waste collection tonnage has generally deceased between 12 – 22%.
ICI tonnage continues to be depressed but after two weeks of no change, is showing some signs of resurgence as the economy is starting to open. Toronto remains the hardest hit area in terms of ICI tonnage reductions.
The week of April 27th, 2020 appears to be the bottom in terms of reduced tonnage and collection activity. Over the past week, front end and roll-off tonnage has increased between 1-5% and a small increase in service and service frequency has been observed.
Suspension of collection services appears to have peaked at 12 – 17% – a reflection of businesses being closed. For the week of May 4th, customers have started to request collection services again and the weekly increase in ‘lifts’ has increased 4% on average.
Restaurant waste remains hardest hit at a 65% reduction (slight improvement of 5% over last report), manufacturing remains down 15%. Food processing waste increases on average at 20% remain constant as do increases in health care waste generally. Seniors home waste collection services and tonnage has increased substantially with the renewed focus on health care protection and alleviating COVID-19 outbreaks.
OCC volume from the ICI sector remains depressed in the range of 40 – 50%.
ICI collection companies are beginning to plan for increased waste tonnage and collection frequencies as the province moves gradually towards opening the economy.


